 Tesseract
How an AI data analyst shows every change to your data
Inside Tesseract's data maker: a first look at your file, a plan you approve, a re-runnable script, charts from its output and every change listed.
Tesseract’s data maker copies your spreadsheet into a folder, shows what it read before asking anything, agrees a short plan with you, and then has the agent write one re-runnable script that computes every number. The charts, key figures and findings on the card are drawn from that script’s output, with every change to the data listed.
This post explains how that is put together: what the first look reads, why the model never types a number onto the card, and how cleaning is made visible. The one-paragraph announcement is in every card on Home now opens a guided maker; this is the long version for Analyze data.
What goes wrong when a model analyses a spreadsheet?
Language models are good at sounding like analysts. Hand one a CSV and it will tell you sales grew 12% in the second half. Four things can be quietly wrong with that sentence.
It read the file wrong. Half of Europe writes 1.234,56 for a thousand and a bit, separates fields with semicolons, and exports from older Excel in a legacy code page. Read as plain CSV, the amounts become text or the wrong magnitude.
It cleaned the data and did not say so. Blank rows dropped, duplicates removed, an outlier left out: each is a reasonable choice, and each changes the answer. If nobody lists them, nobody can disagree with them.
The number came from prose. A model can compute with code and then paraphrase the result, rounding or misremembering it on the way into the sentence.
Nothing can be re-run. Next month’s file arrives and the analysis has to be done again from scratch, possibly differently.
The data maker is designed against all four.
How does the data maker work, step by step?
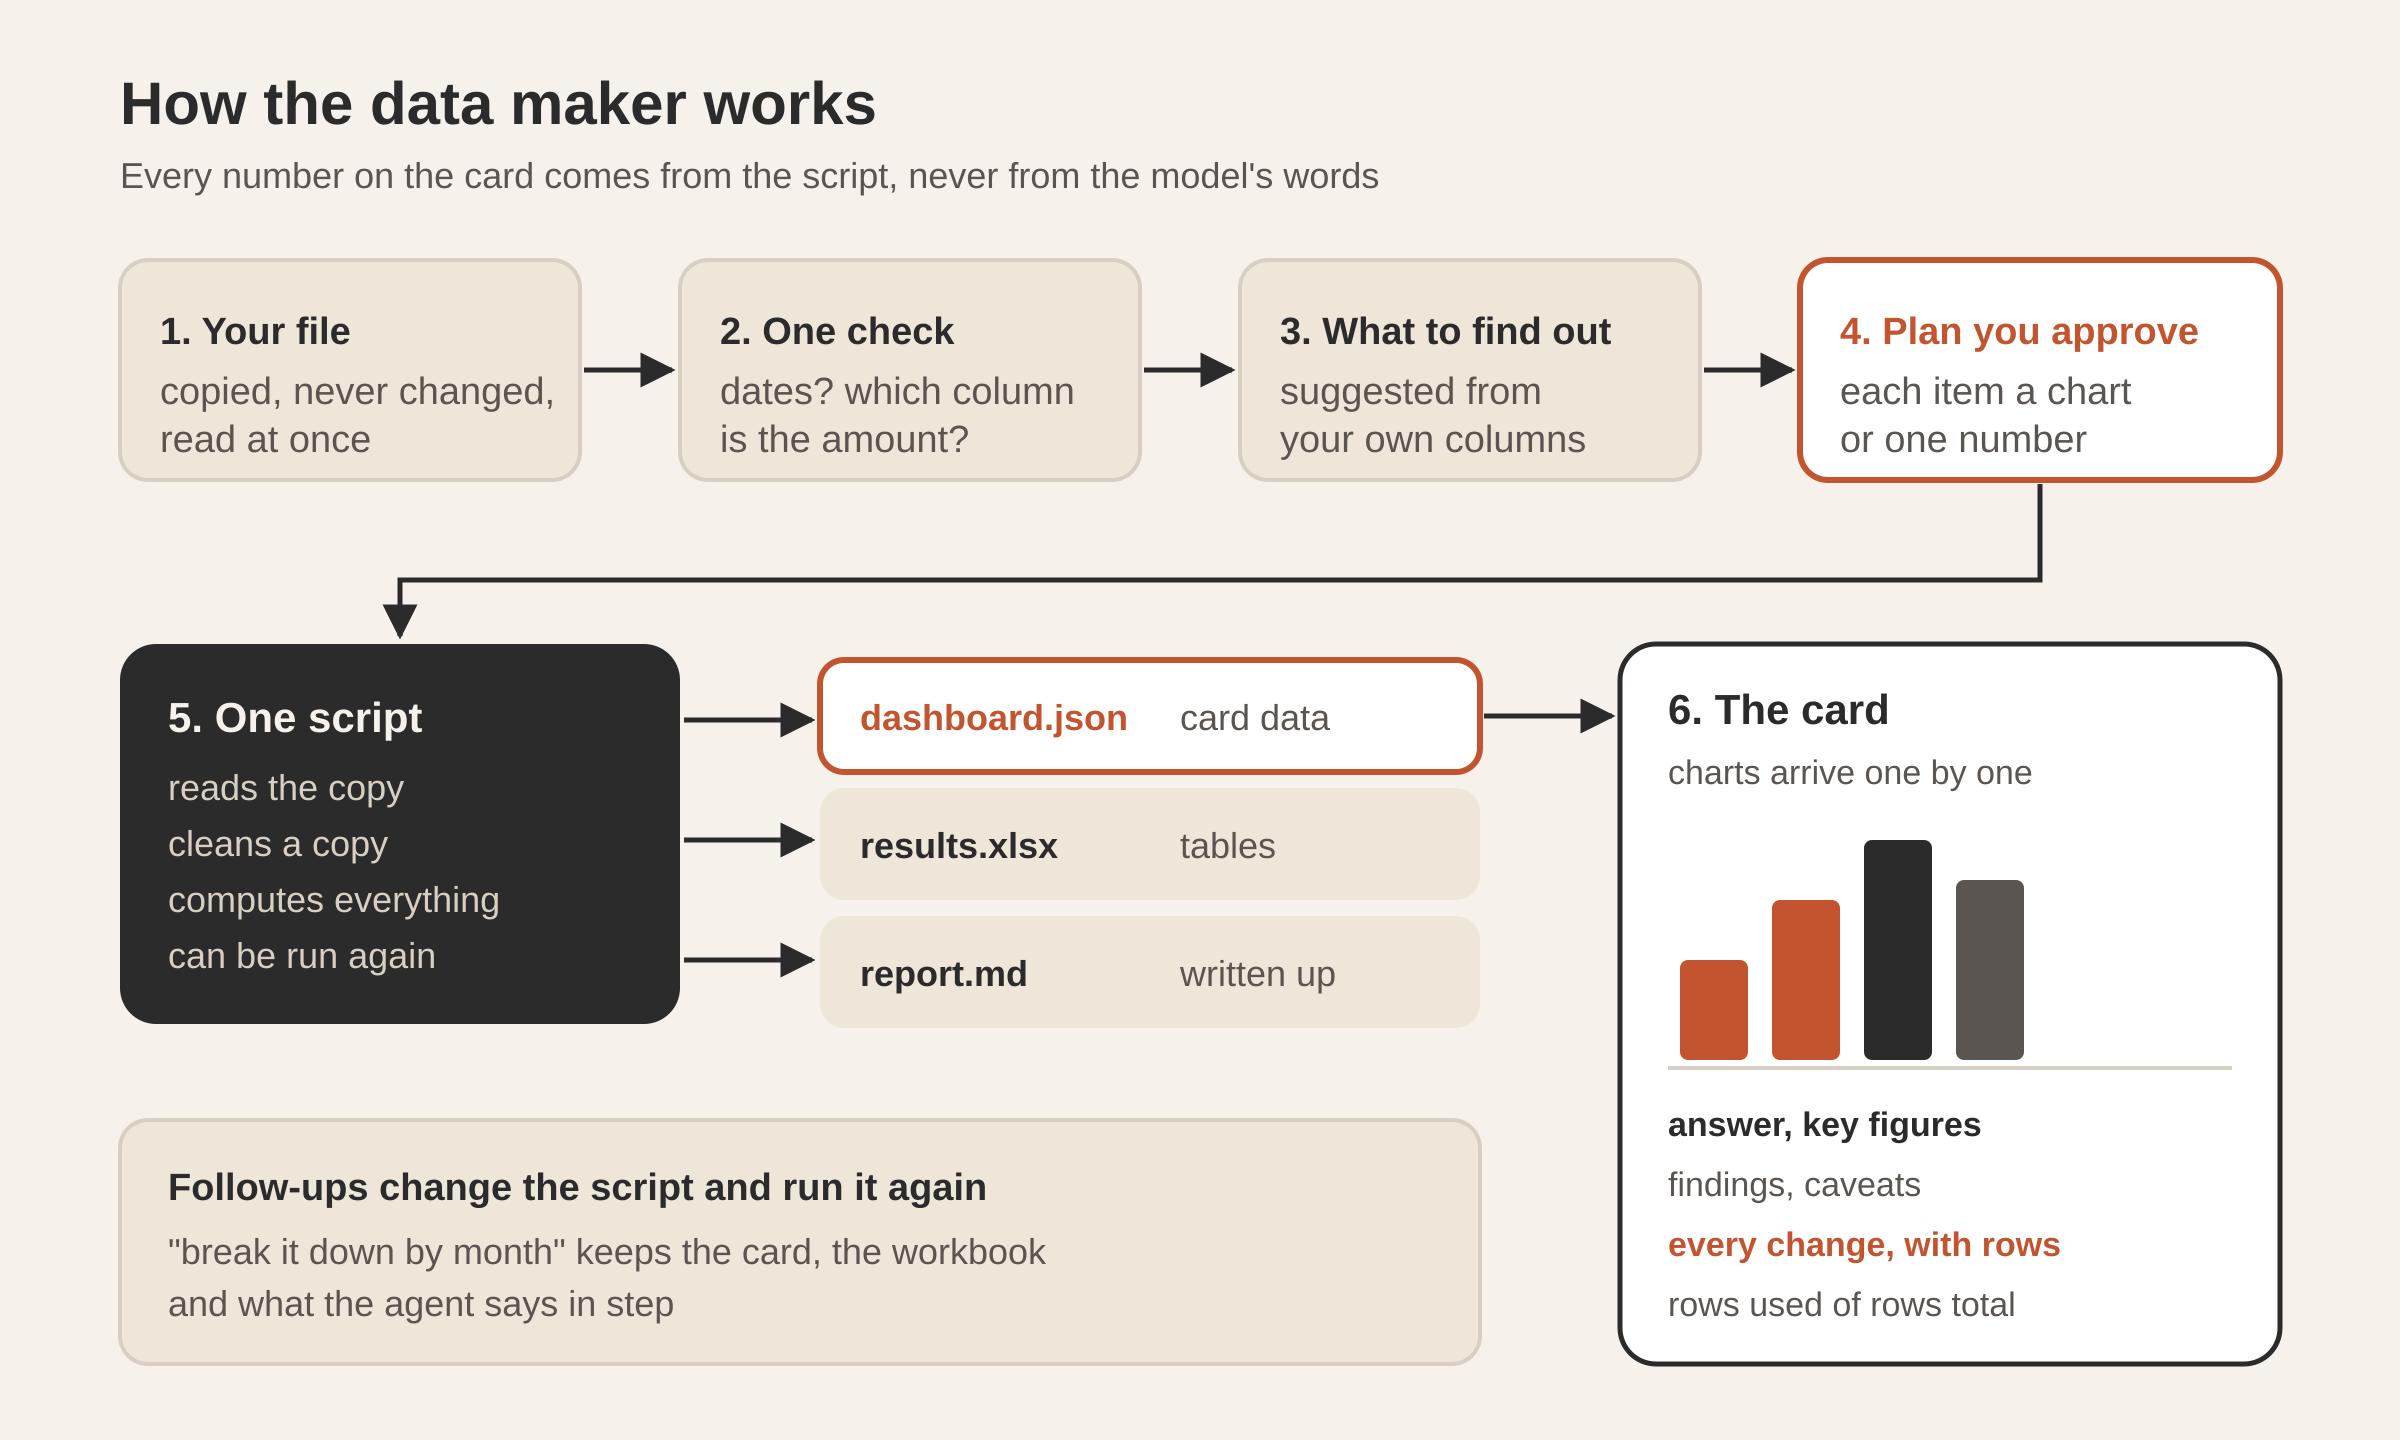
- The data. Drop a file on the card or the chat, choose one, paste a table into the message box, or try the sample. It is copied into the analysis’s own folder and read at once.
- Only what is open. Which sheet, when a workbook has several. And one check question, when the data can be read two ways that change the numbers.
- What to find out. Three or four questions this data can answer, suggested from its own columns, or your own words. Give me the overview leaves it to the analysis.
- The plan. The few things it will look at, each shown as a chart or a single number, before anything runs. You change it by talking, then press Analyze.
- The analysis. One turn of the conversation’s own agent with the data-analysis skill. The charts arrive on the card as each is worked out; then the answer, the key figures, the findings, every change made to the data and what the data cannot say.
What does the first look read?
The moment a file arrives, before any model sees it, the app reads it itself and shows what it found: rows, columns, each column’s kind and the first rows. The card’s line reads like “1,204 rows · 9 columns · separated by semicolons”.
The reader takes CSV, TSV, TXT, Excel (xlsx, xlsm, xls), OpenDocument (ods) and JSON (an array of records). Delimited files are read from their first few megabytes with any delimiter, quoted fields, and UTF-8 or a legacy code page, and their rows are counted to the end. Workbooks have their first rows parsed for the first look. Each column gets a kind (number, date, text, true/false or empty), a count of blanks among the rows looked at, and a few example values as written.
That description is what the model reads to suggest questions. It also decides whether the file is data at all: a workbook of notes, or a file with no rows of values under column names, gets a plain “this doesn’t look like data to analyse” and a request for another file, not an invented analysis.
The first look is quick by design. The agent’s launch message includes the description with the instruction to check it against the whole file.
Why does it ask about dates and amounts?
One question is worth asking before any number is computed: the one where the data can honestly be read two ways and the two readings give different answers. 03/04/2025 is the 3rd of April in most of Europe and the 4th of March in the United States. A sheet with both “Total” and “Net” columns could mean either by “sales”.
The model reading the data may raise exactly one such check, with likely answers to tap. If you press You choose, it takes the most likely reading and records your answer as “my guess — say if it’s wrong”, so the choice is visible later instead of silently baked in.
It also says, in a sentence, what one row is: “One row is one sale.” Naming the grain early catches a common error, counting receipts when the rows are lines on a receipt.
What does the plan look like?
The plan is a short list of questions, each with how it will be shown (“a chart over time”, “a ranking”, “one number”, “a comparison”). It is saved in the folder as a checklist the agent ticks as it goes, with the same marks the research maker uses: x answered, ~ partly, ! the data cannot answer it.
That last mark matters. “Which product has the best margin?” cannot be answered from a file with no cost column, and the honest result is a mark that says so, not a margin estimated from nothing.
Where does the work happen?
Everything lives in one folder per analysis under Documents/Tesseract/Analyses/:
| File | What it holds |
|---|---|
data/ | the copy of your file; your original is never touched |
plan.md | the approved plan, ticked as it goes |
analysis/analysis.py | one re-runnable script: reads the data, cleans a copy, computes everything, writes the outputs |
dashboard.json | what the card draws: answer, key figures, charts, findings, caveats, changes |
results.xlsx | the cleaned data on one sheet, and the table behind each chart on its own sheet |
report.md | the answer, the findings with their numbers, the changes and the caveats |
The agent is told to work in Python with pandas. If pandas is missing, it makes a virtual environment inside the analysis folder and installs pandas and openpyxl there, rather than touching the system Python.
The copy of your file, the script and the outputs stay in a folder on your computer.
Because the whole analysis is a script that reads data/ and writes everything else, it can be run again on a corrected or newer file, and a follow-up question changes the script and re-runs it instead of starting over.
Why can’t the model type a number onto the card?
This is the central rule: every number on the card comes from the analysis’s own script. The agent’s instruction says every number is computed by code from the data, never estimated, and the card is not drawn from the agent’s chat message at all. It is drawn from dashboard.json, which the script writes.
The file has a fixed shape the agent is given word for word. An abbreviated version:
{
  "answer": "the bottom line in one or two sentences, with the key number",
  "rowsUsed": 1180, "rowsTotal": 1204,
  "kpis": [{ "label": "Sales, 2025", "value": 48210.5, "format": "currency:EUR",
             "change": 0.12, "compare": "vs 2024", "goodWhen": "up" }],
  "charts": [{ "title": "the takeaway as a sentence", "type": "line",
               "series": [{ "name": "Sales", "points": [["2025-01", 3120.5]] }],
               "note": "n = 1,180 sales; 24 rows left out (see changes)" }],
  "findings": [{ "text": "a finding with its number", "confidence": "medium" }],
  "caveats": ["what this data cannot say"],
  "changes": [{ "step": "Removed 3 rows that were exact duplicates", "rows": 3 }]
}
When the run ends, the answer shown first in the chat is the one in that file. The agent’s own closing words are used only when the file has none.
The card reads the file carefully, so a half-written file during a run, or one from an older version, still shows what it holds. The file is written as soon as the first chart is computed and again after each one, which is why charts appear one by one while the analysis is still going. A dashboard left from an earlier run is deleted before a new run starts, so you never see last time’s charts under this time’s plan.
How is every change to the data made visible?
The changes list has strict rules. Every change made to the data goes in, each with the number of rows it touched: duplicates removed, blanks dropped or filled, values fixed, outliers left out. A deliberate choice to keep rows that look wrong goes in too. And the opposite rule: no line saying “nothing changed”. If nothing changed, the list is empty.
Alongside it, rowsUsed and rowsTotal say how many rows the numbers rest on out of all the rows in the file. If 24 rows were left out, the card says 1,180 of 1,204, and the changes list says why.
The data-analysis skill behind it adds the analyst’s habits:
- Profile before trusting. For each column that matters: its type as loaded against what it should be, missing values and whether they follow a pattern, ranges and impossibilities, duplicates on the key, units, currencies, time zones.
- Check row counts before and after every filter and join. A join that changes the count unexpectedly is a bug until shown otherwise.
- Do not drop outliers for being extreme. Look at them; remove only proven errors; report it.
- Report
nfor every group compared, prefer medians when the data is skewed, check that an effect holds within segments as well as overall, and say “associated with” unless the data comes from an experiment.
How are the charts drawn?
The card draws each chart itself, as SVG at the card’s real width, from the series in dashboard.json. It is not a picture the agent rendered. That has practical consequences: hover or the arrow keys read exact values, the chart type can be switched between the forms the same data can take, Show data lists every number, and the chart can be saved as PNG. Its colours come from the app’s own chart palette, in light and dark.
To keep charts readable, the agent is told to aggregate first: at most 200 points per series and 12 series per chart, time on the x axis in order, and a title that states the takeaway (“Riverside grows every month”) rather than the topic (“Sales by shop”).
What do you get at the end?
The card shows the answer, the key figures, the charts, the findings with their confidence, the changes and the caveats. results.xlsx opens in the spreadsheet editor in the card beside the chat, where you and the agent can both work on it; opening it in Excel or Numbers is a second option. Save as PDF prints the card as it is shown.
The conversation carries on about the analysis: “break it down by month”, “why is March low?”. Every later turn is told to change the script and run it again, so that the dashboard file and the workbook stay in step with what the agent says, every number still from code and every change still listed. A change to the workbook alone, a format or a note, is made in the workbook.
Why does the sample have mistakes in it?
Try the sample loads a year of sales for an invented three-shop café, generated the same way every time. It is not clean on purpose. It has the things real exports have: seasons (iced coffee up in summer, tea up in winter), one shop growing month by month, busier weekends, a few blank payment types, three rows duplicated and one quantity mistyped as 40.
A clean sample would show off the charts and hide the part that matters. With this one, a good run should list the duplicates and the blank payments in its changes, and either catch the typo or explain why it kept it. You can see the cleaning rules work before you trust them with your own file.
What did we decide against?
- Asking questions before reading the file. The first look comes first, so the suggestions are about your columns, not generic.
- Charts as images from the model. A picture can’t be hovered, checked or switched, and its numbers can’t be compared with the workbook.
- A summary in the agent’s own words as the result. Words are where numbers drift. The answer on the card is the one the script wrote.
- Cleaning without a ledger. Every analysis tool cleans. Listing each change with its row count is what lets you disagree with one.
Questions
Does it change my original file? No. The file is copied into the analysis folder’s data folder, and the script reads that copy and cleans a further copy.
Which files can I use? CSV, TSV, TXT, Excel (xlsx, xlsm, xls), OpenDocument spreadsheets (ods), JSON as an array of records, or a table pasted into the message box.
Can I re-run it next month on new data? Yes. The analysis is one script in its folder; replace the data and ask the agent to run it again, or start a new analysis.
Why does the card say fewer rows than my file has? The numbers rest on the rows that survived cleaning. The changes list says which rows were left out and why.
Can I edit the results? Yes. The results workbook opens in the spreadsheet editor beside the chat, and both you and the agent can change it.
For more on what the agent can do with your files, see what Tesseract makes. To try it on a real spreadsheet, download Tesseract and open Analyze data on Home.